
CFOs: Four Automation Case Studies That Prove Cost Savings
CFOs: Four Automation Case Studies That Prove Cost Savings
That range holds up across customer support, back office, and warehouse deployments, but only when you model conservatively from the start. The case studies below show exactly how those numbers get built, and where the modeling usually goes wrong.
TL;DR:
- Automation in customer support can reduce contact costs by 35 to 55 percent, with Tier 1 deflection rates often between 40 and 75 percent.
- Warehouse automation payback periods typically range from 11 to 28 months, with throughput gains and staff redeployment offsetting capital expenses.
- Small-scale purchase order automation projects can break even within seven weeks, especially when staff are redeployed rather than laid off.
- Modeling expected savings at 65 to 75 percent of vendor claims helps account for real-world complexities and improves accuracy.
- Sustaining automation savings requires ongoing measurement, clear ownership, and quarterly reviews to prevent gradual erosion over time.
Table of Contents
- Automation ROI Benchmarks You Can Take to the CFO
- Four Real Automation Case Studies With Before/After Numbers
- How to Measure and Report Automation Savings
- Keeping the Savings After the Automation Goes Live
- Why Most Automation Projects Underdeliver on Paper but Overdeliver in Practice
- Get a Pilot Estimate Before You Commit to a Build
- Sources
Automation ROI Benchmarks You Can Take to the CFO
Before you build a business case, you need numbers you can defend in a room full of skeptics. Every serious automation cost savings case study starts with the same three data points: what a task costs today, what it will cost after automation, and how fast the difference pays back the investment.
Industry benchmarks give you a starting range, broken down by function:
- Customer support automation: cost-per-contact reductions of 35 to 55%, with Tier 1 deflection rates commonly range from 40% to 75%.
- Back-office and document processing: large error-rate reductions and processing times cut roughly in half in many reported projects.
BCG’s research on enterprise AI deployment adds useful context at the top end. Companies that redesign processes around AI, rather than bolting automation onto existing workflows, can reduce operating expenses by approximately 30% on large cost bases. That same research found AI leaders achieve roughly three times greater cost reduction than companies that treat automation as a bolt-on tool rather than a redesign of how work gets done.
Before you model anything, collect these baseline numbers:
- Fully loaded labor cost per FTE (salary, benefits, overhead)
- Transaction or ticket volume per month
- Current average handling time per task
- Error and rework cost, including time spent fixing mistakes
Automation savings usually land in a wideband because vendor pitches assume perfect conditions. Practitioner guidance suggests modeling initial-year results at 65 to 75% of vendor claims, then letting year two absorb the gap as staff adapt and processes get refined.
Once you have baseline numbers, build three scenarios: conservative, expected, and optimistic. A reasonable starting point puts the conservative scenario at 50 to 75% of what the vendor promises, based on practitioner guidance from BCG’s cost-advantage research. Your payback calculation needs to include more than software fees. Add implementation costs, integration work, and change management, because first-year total cost of ownership often amounts to between 40% and 60% of projected annual savings once those line items are counted honestly.
Four Real Automation Case Studies With Before/After Numbers
Numbers convince finance teams faster than promises do. Here are four automation deployments with documented before/after metrics, each representing a different category of cost reduction.
1. Back-office automation on top of an existing ERP system
A mid-market manufacturer running SAP replaced 23 back-office roles with AI-driven workflow agents layered onto its existing ERP. The result was a multi-million-dollar annual reduction in labor costs, alongside faster processing times and fewer errors in the reported case. Integration friction was the biggest obstacle. Connecting agents to legacy ERP data structures took longer than the software rollout itself, which is typical for back-office automation projects layered onto systems that were never designed for it. The recurring savings, once the integration settled, came from eliminated headcount rather than one-time efficiency gains.
2. Customer support deflection and cost-per-contact reduction
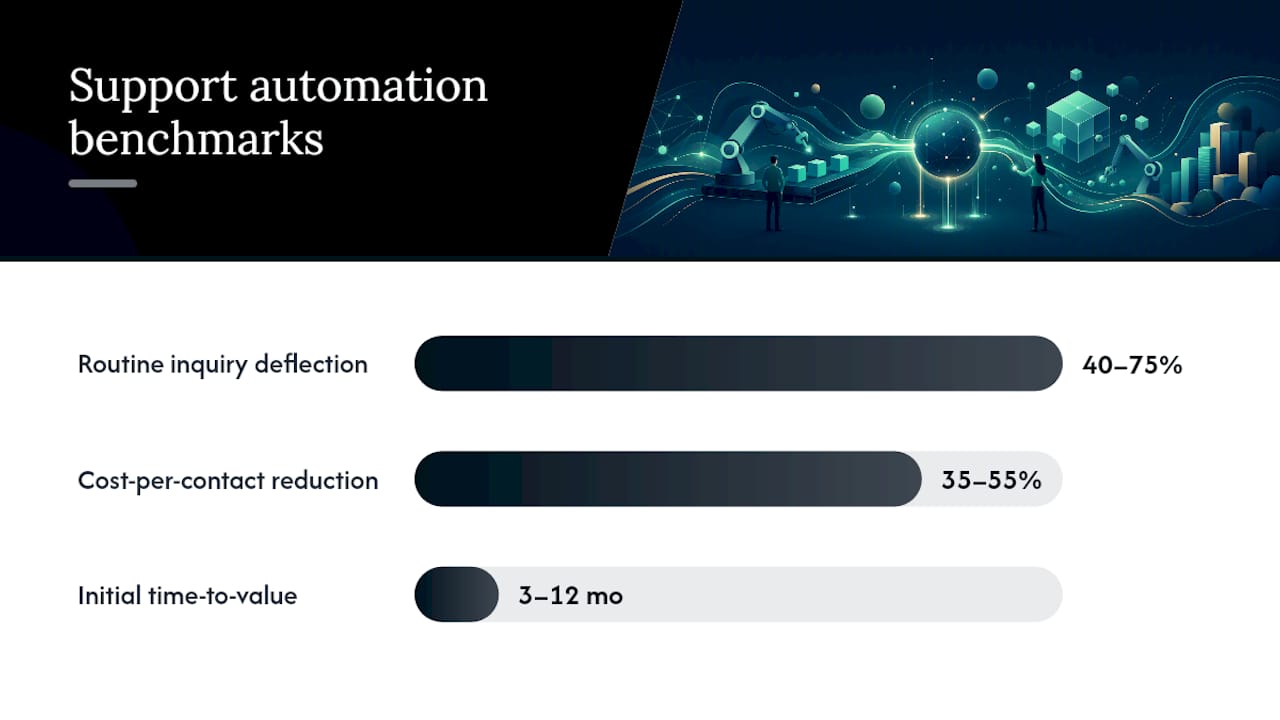
Support automation tends to deliver the fastest visible wins because volume is high and tasks are repetitive. Deflection rates of 40 to 75% for routine Tier 1 inquiries translate directly into cost-per-contact drops of 35 to 55%, according to aggregated benchmarks from enterprise automation ROI data. Time-to-value is typically 3 to 12 months for initial wins, faster than back-office or warehouse projects because support automation rarely requires deep integration with core financial systems. One nuance worth flagging: speech-to-text accuracy directly affects deflection quality in voice-based support. Teams evaluating voice automation should treat model selection for speech recognition as a cost lever, not a technical afterthought, since a poorly matched model raises escalation rates and erases the savings on paper.
3. Warehouse automation with mobile robots and sortation systems
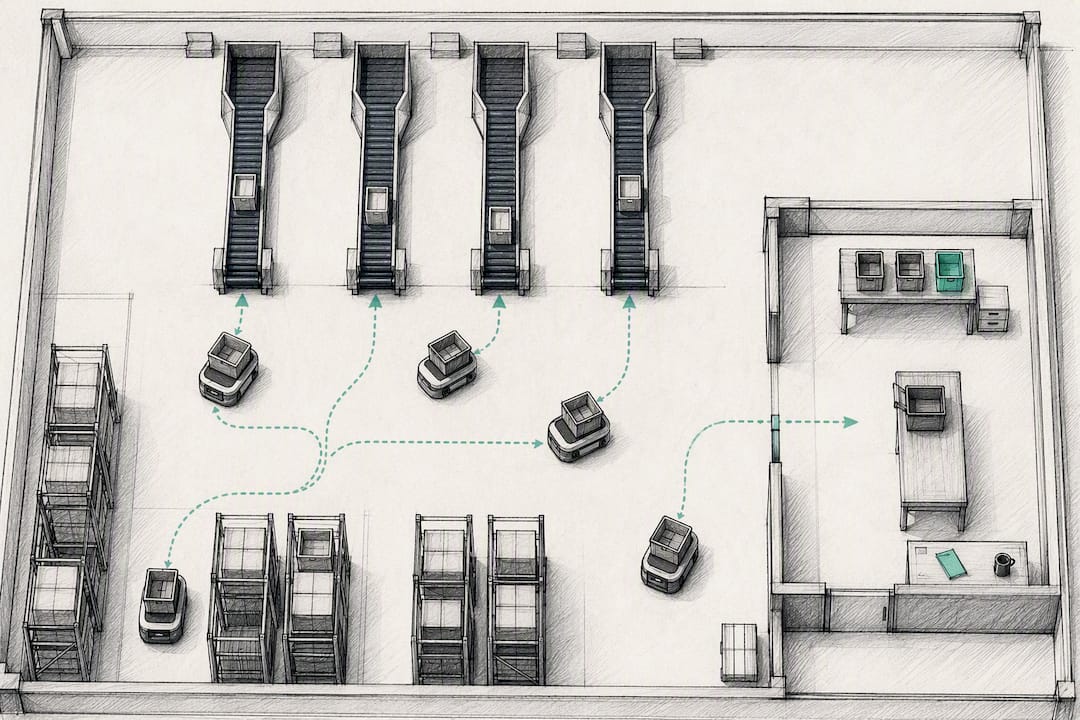
Warehouse deployments carry higher upfront capital costs than software-only automation, which shows up in longer payback windows. Verified financial data across five facility deployments showed payback periods of 11 to 28 months, with throughput gains offsetting the capital outlay over that window. Headcount didn’t disappear in these cases so much as shift, with staff redeployed to exception handling and quality control as automated systems absorbed routine picking and sorting.
4. Purchase order and invoice automation as a fast-payback starter project
Not every automation project needs a seven-figure budget to prove value. A small purchase-order automation project cut processing time from 40 hours a week down to a fraction of that, and hit break-even in seven weeks on a modest implementation cost. This is the case study worth showing to a skeptical board member who thinks automation only pays off at enterprise scale. The staff who used to spend their week on manual PO matching were redeployed to vendor negotiation and exception review, not laid off, which mattered for internal buy-in.
| Case study | Automation type | Payback window | Modeling note |
|---|---|---|---|
| ERP back-office roles | Workflow agents on SAP | Not publicly listed | Recurring labor savings; integration friction extended timeline |
| Customer support deflection | Tier 1 chat/voice automation | 3 to 12 months | Deflection-driven; recurring cost-per-contact reduction |
| Warehouse robotics | Mobile robots and sortation | 11 to 28 months | Year 1 at 65 to 85% of projection; improves in year 2 |
| Purchase order automation | Invoice/PO workflow | seven weeks | Fast, small-scale; staff redeployed, not cut |
Take that as the norm, not the exception, when you build your own model. A small automation build like a targeted workflow automation project can produce PO-style fast paybacks even without enterprise-scale budgets.
How to Measure and Report Automation Savings
A business case that survives CFO scrutiny needs a formula, not a vibe. Use this:
Net annual savings = (current cost × reduction %) − (annual platform cost + implementation cost + change management cost)
- Pull four numbers before modeling anything: transaction volume, fully loaded cost per FTE, error and rework cost, and current average handling time.
- Build three scenarios, conservative, expected, and optimistic, with the conservative case set at 50 to 75% of vendor claims.
- Set checkpoints at 30, 90, and 180 days, tracking actual reduction percentage against the modeled scenario at each stage.
- Report variance honestly at each checkpoint rather than waiting for a year-end reconciliation.
Pro Tip: *Include capacity expansion and staff redeployment value as conservative upside, not guaranteed savings.
Keeping the Savings After the Automation Goes Live
The hardest part of any automation cost savings case study isn’t the launch. It’s month fourteen, when the person who championed the project has moved to a different priority and nobody’s watching the dashboard anymore. Savings erode quietly. A support bot’s deflection rate drifts down as customers ask new kinds of questions it wasn’t trained on. A warehouse robot’s throughput dips because nobody updated the routing logic after a layout change. Back-office error rates creep back up as new hires bypass the automated workflow because the old spreadsheet was faster for them personally.
Sustaining automation savings requires the same discipline you’d apply to any recurring cost line: monthly variance tracking against the original model, not just a one-time victory lap after go-live. Assign clear ownership, ideally at the CFO or department head level, so savings targets don’t quietly get reabsorbed into headcount growth elsewhere. That governance point matters enough that BCG’s research on AI-first cost advantage flags it directly: without clear P&L ownership, automated savings tend to evaporate within a few quarters as budgets creep back up around the edges.
Build a quarterly review into the same cadence as your other cost audits. Check the automation’s error rate, volume handled, and actual dollar savings against the year-one model. If the numbers are still tracking to the conservative scenario after four quarters, you’ve got a genuinely durable win. If they’re drifting, you’ll catch it before it becomes a budget surprise.
Why Most Automation Projects Underdeliver on Paper but Overdeliver in Practice
Here’s the pattern I keep seeing across automation case studies: the headline ROI number almost always undersells what happened.
That’s the opposite of how most vendor pitches frame automation. Vendors sell the big year-one number. The conventional wisdom says automation is a technology purchase. The case studies say it’s a process redesign with software attached, and the companies that treat it that way are the ones getting the three-times cost advantage BCG documents. Everyone else gets a partial win and calls it a failure.
The real lesson from every one of these case studies is discipline, not ambition. The businesses that win aren’t the ones that automate the most. They’re the ones that measured the baseline honestly, modeled conservatively, and kept watching the number after launch instead of moving on to the next project.
— Lakitha
Get a Pilot Estimate Before You Commit to a Build
You don’t need to guess at your own numbers after reading four case studies. You can engage services that build fixed-price MVPs and automation pilots quickly, so you get a working system with real cost data fast, instead of a six-month roadmap and a vendor promise. That speed matters here specifically: a working pilot gives you actual before/after numbers to plug into the conservative modeling framework above, rather than a projection borrowed from someone else’s case study.
Zatersio’s free automation blueprint maps out where automation would save the most in your operation, whether that’s back-office processing, customer support, or purchase-order workflows, before you spend a dollar on a build. Projects can also qualify for the R&D Tax Incentive, and you choose your own data residency setup for compliance. If you’re ready to see what a pilot would actually cost and save, start with a workflow automation project scoped for your business.
Sources
- Why most AI cost-reduction programs fall short
- How leaders build an AI-first cost advantage
- The CFO’s guide to AI automation ROI: How enterprises are cutting operational costs by 40% or more