
Cut LLM Spend 60–90%: An Engineering First Cost Optimization Playbook
Cut LLM Spend 60–90%: An Engineering First Cost Optimization Playbook
The fastest way to cut your LLM bill is to measure first, then apply prompt compaction, caching, batching, and model routing in that order before you ever consider fine-tuning or self-hosting. That single stack typically saves 60–90% of production API spend, when the levers are combined correctly. Start today by turning on per-request token telemetry and a daily spend alert. Everything else follows from what those numbers tell you.
TL;DR:
- Measuring token usage and setting spend alerts are crucial steps before applying prompt compaction, caching, or routing to identify cost drivers.
- Context window inflation, overly large system prompts, overretrieval in RAG, retry storms, and separate API calls for monitoring significantly inflate costs.
- Tracking detailed request metrics and establishing KPIs such as cache hit rates and model routing distribution inform targeted savings strategies.
- Sequentially applying prompt optimization, caching, routing, batching, and then fine-tuning yields the greatest cost reduction, often over 60%.
- Self-hosting only becomes cost-effective at very high token volumes, while ongoing cost monitoring and regular recalibration are essential to prevent drift in production.
Table of Contents
- Where LLM Costs Actually Come From
- What Metrics Should You Track Before Optimizing?
- The Levers That Actually Move Your Bill
- How to Roll Out Cost Optimization Without Breaking Production
- What Does the Break-Even Math Actually Look Like?
- Keeping Costs Down After You’ve Optimized
- How a Delivery Partner Fits Into the Cost Equation
- Where I’d Start If I Were You
- Sources
Where LLM Costs Actually Come From
Every LLM bill boils down to one formula: (input tokens × input price) + (output tokens × output price). That looks simple until you realize how many hidden multipliers inflate the token count before a single word gets billed.
Context window bloat is the biggest offender. Chat applications resend the entire conversation history with every turn, so a 20-turn support session doesn’t cost 20× a single message. It costs closer to 200× because each new turn drags along every prior turn’s tokens. Add a system prompt with detailed instructions and a few tool definitions, and you’re paying for the same 800 tokens of boilerplate on every single call.
Retrieval-augmented generation (RAG) adds its own tax. Every retrieved chunk gets stuffed into the prompt, embedding calls run separately (and get billed separately), and a retrieval step that pulls five documents instead of two can quietly double your input tokens without improving the answer. Retries compound the damage: a failed function call or a malformed JSON response triggers a full re-send of the prompt, and teams that don’t log retry rates are often shocked to discover 10 to 15% of their spend comes from calls that never produced a usable result the first time.
The hidden cost drivers worth auditing first:
- Context window creep: full chat history resent on every turn instead of a summarized state
- Oversized system prompts: static instructions and tool schemas repeated on every request
- RAG overretrieval: pulling more chunks than the model actually needs to answer
- Retry storms: malformed outputs or timeouts causing silent duplicate billing
- Embedding and monitoring overhead: separate API calls for vector search and logging that get lost in “miscellaneous” spend
None of this shows up clearly on a monthly invoice. It shows up in your token counts, which is exactly why the next step matters more than any lever you’ll read about below.
What Metrics Should You Track Before Optimizing?
You cannot optimize what you cannot measure per request. Before touching a single prompt or routing rule, instrument every call with a consistent schema: tokens in, tokens out, model used, route taken, prompt template version, originating feature, retry count, and a cache hit flag. Without that granularity, you’re guessing which lever will actually move your bill.
From that raw log, a handful of derived KPIs tell you where to focus:
| Metric | What it reveals | Target to aim for |
|---|---|---|
| Cost per request | Baseline unit economics by feature | Trending down month over month |
| Cost per session | True user-facing cost, including retries and context growth | Flat or declining as usage scales |
| Cache hit rate | How much traffic is repetitive or near-duplicate | Above 30% for repetitive workloads |
| Model routing distribution | Share of traffic on frontier vs. small models | Small models handling 60%+ of mixed workloads |
| Daily spend rate | Early warning for anomalies or runaway loops | Stable, with automated deviation alerts |
Production systems often find that 30 to 60% of traffic is either cacheable or safely routable to a cheaper model, but you only find that by sampling live traffic and simulating a router against historical logs before you ever deploy one. Skipping that step is how teams end up routing 20% of eligible traffic to expensive models simply because nobody checked.
Set anomaly detection on daily spend from week one. A single looping agent or a misconfigured retry policy can burn through a month’s budget in an afternoon, and the only way to catch it before the invoice arrives is a rolling average with a threshold alert.
The Levers That Actually Move Your Bill
Once telemetry is running, the order in which you apply levers determines how much of the theoretical savings you actually capture. Each lever shrinks the base the next one operates on, so sequencing matters as much as the individual tactics.
Prompt optimization and compaction
A structured prompt audit typically trims 20 to 40% off input tokens with zero quality loss. Run the audit against these checkpoints:
- Strip unused tool schemas and legacy instructions left over from earlier iterations
- Replace verbose few-shot examples with shorter, higher-signal ones
- Summarize conversation history instead of resending the full transcript past a fixed turn count
- Move static boilerplate into a cached system message instead of repeating it in the user payload
Pro Tip: *Run your compacted prompt against your eval set before shipping it.
Prompt caching vs. semantic caching
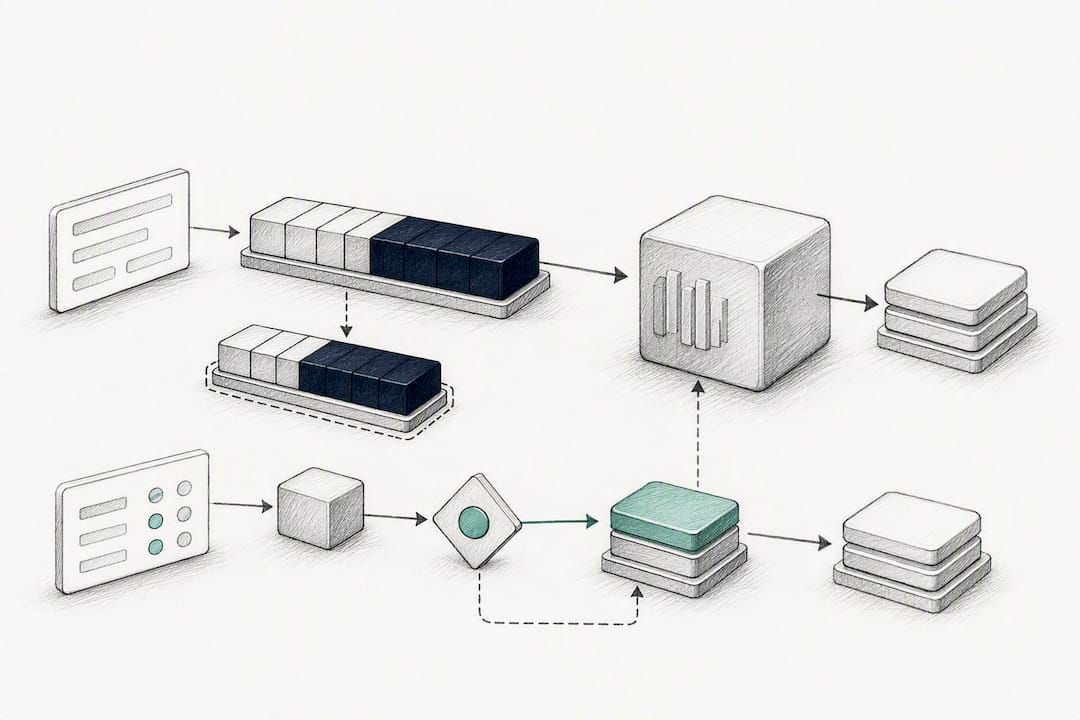
These solve different problems and teams often conflate them. It requires no infrastructure beyond structuring your prompt so the static part comes first.
Semantic caching is different: it stores full responses keyed by embedding similarity, so a rephrased question can still hit the cache. That power comes with risk. Set cosine similarity thresholds conservatively, at 0.95 or higher, and log every cache hit for manual review during rollout so you catch a wrong-answer-served-as-cached-hit before your users do. Pair it with a fast fallback path so a cache miss never becomes a user-facing delay.
Model routing and cascading
Routing sends easy requests to cheap models and hard ones to frontier models. Start with simple rule-based routing (keyword or length heuristics), then graduate to a lightweight classifier, then add a verifier model that catches low-confidence outputs from the small model before they reach the user. This crawl-walk-run approach is how production routers earn trust instead of breaking on day one.
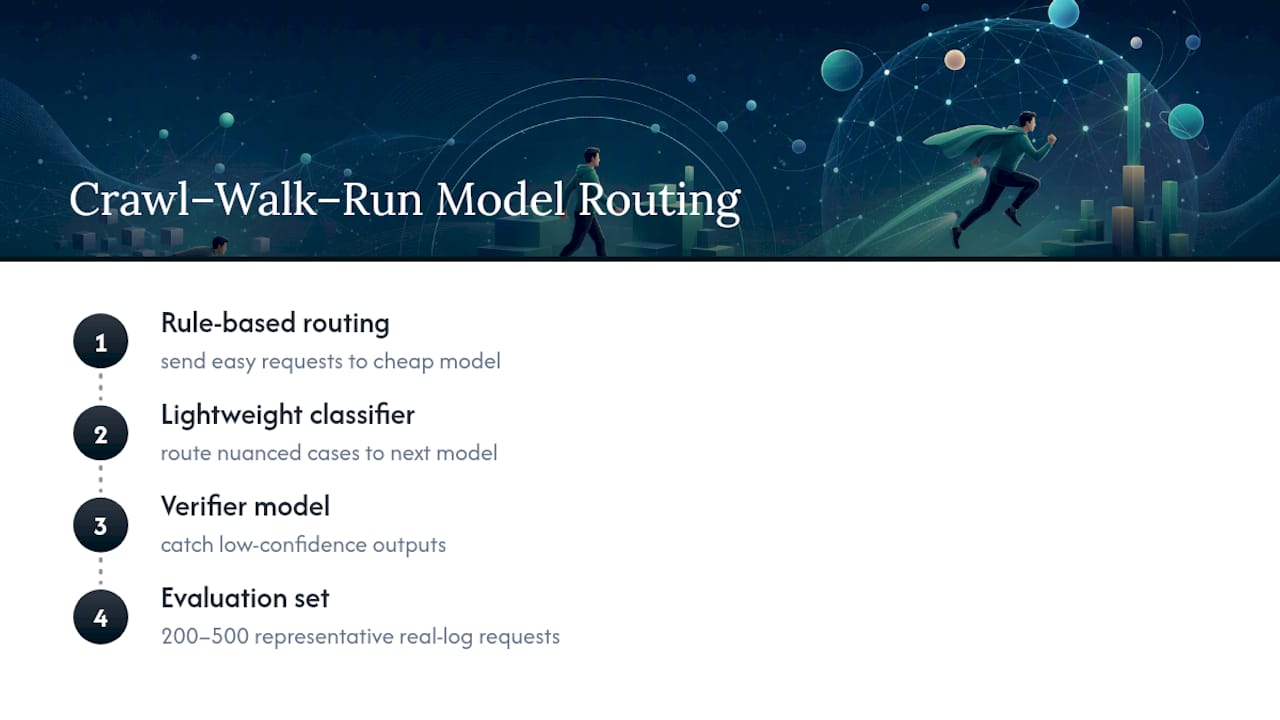
Before trusting any router with real traffic, build an evaluation set of 200 to 500 representative requests pulled from actual logs, not synthetic examples.
Batch APIs for async workloads
Any workload that doesn’t need a response in real time (nightly summarization, bulk classification, report generation) is a candidate for batch endpoints. Provider batch APIs typically discount both input and output tokens by about 50% in exchange for a 24 hour turnaround SLA. Batch endpoints are usually the cheapest engineering lift of any lever on this list; teams routinely halve the cost of their offline tail in an afternoon of integration work.
Fine-tuning and self-hosting
This is the highest-effort, highest-reward lever, and it only pays off past a volume threshold. Self-hosting open-source models can cut per-token cost by 80 to 95% at high volume, but you’re trading API fees for GPU rental, ops staffing, model versioning, and monitoring infrastructure. Below a certain monthly token count, that trade is a net loss. Above it, it’s the biggest line item on your savings sheet.
Supporting levers worth knowing
Output-shape discipline (forcing structured JSON instead of free-form prose) and hard token caps on generation length quietly save money on every single call. Research into training-free inference methods like Reduced Matrix Multiplication shows that input-adaptive computation reductions can translate into real runtime savings without retraining, and layer-wise attention approaches like GLIDE reduce KV cache I/O for long-context generation, both signals that the serving layer itself is a legitimate cost lever, not just prompt engineering; this is why understanding typed memory in AI is crucial for advanced inference optimizations.
How to Roll Out Cost Optimization Without Breaking Production
Sequencing prevents you from over-engineering a routing pipeline before you’ve captured the cheap wins sitting in your batch tail. Work through it in four phases.
- Days 0–7: Turn on per-request telemetry, run a full prompt audit, set hard token caps on generation length, enable exact-match provider caching, and identify every workload with an async tolerance for batch submission.
- Weeks 2–6: Deploy semantic caching with a conservative similarity threshold, introduce basic rule-based routing plus a verifier model, and move identified batch candidates onto batch endpoints.
- Weeks 6–12: Build a routing classifier backed by a 200–500 example eval set, pilot a fine-tuning candidate if volume supports it, and add spend dashboards with spike-simulation tests before you trust any of it unsupervised.
- Ongoing: Daily spend alerts, monthly router recalibration against fresh logs, and a release gate that blocks any prompt or template change from shipping without a quality check against the eval set.
| Phase | Primary goal | Signal you’re ready for the next phase |
|---|---|---|
| Days 0–7 | Visibility and quick wins | Telemetry dashboard live, batch tail identified |
| Weeks 2–6 | Structural savings | Cache hit rate climbing past 20% |
| Weeks 6–12 | Intelligent routing | Eval set built, small-model quality above 95% |
| Ongoing | Sustained control | Spend alerts firing correctly, no manual invoice surprises |
Skipping straight to fine-tuning without this sequence is the single most common way teams burn budget on infrastructure they didn’t need yet.
What Does the Break-Even Math Actually Look Like?
Numbers make this concrete. Assume a mixed workload of 1,000 requests averaging 1,500 input tokens and 500 output tokens each on a frontier model.
| Scenario | Approach | Relative cost per 1,000 requests |
|---|---|---|
| Baseline | No optimization, frontier model only | 100% reference point |
| Prompt compaction only | 35% token reduction via audit | 60–90% |
| Compaction + caching | Cached system prompt, 40% cache hit rate | ~40% |
| Compaction + caching + routing | 60% of traffic routed to small model | 20 to 40% |
| Full stack + batch (async share) | Batch discount applied to eligible tail | ~15–20% |
Combining prompt compaction, caching, batching, and model routing typically cuts overall spend by 60 to 90% compared to an unoptimized baseline, and the table above shows why: each lever shrinks the base the next one multiplies against.
Fine-tuning or self-hosting only makes sense past a specific volume threshold. If your monthly token count is high enough that GPU rental plus ops overhead costs less than the equivalent API spend, self-hosting wins. Below that line, you’re paying fixed infrastructure costs to save variable ones you haven’t earned yet. As a rough model: a workload processing under a few million tokens a month rarely clears the break-even point once you account for a part-time ML engineer’s salary against the infrastructure. A workload processing hundreds of millions of tokens a month almost always does.
Traffic spikes change this math sharply. A 3× spike is usually absorbed fine by API vendors since you’re paying per token regardless of volume. A 10× spike on a self-hosted deployment means you either over-provision GPUs you’ll leave idle most of the time, or you scramble to burst back onto a hosted API mid-incident, which erases the savings you fine-tuned for in the first place.
Keeping Costs Down After You’ve Optimized
Optimization work that isn’t monitored decays. Prompt templates drift, traffic mixes shift, and a well-tuned router from three months ago can silently degrade as usage patterns change.
Set up three categories of tooling: request-level telemetry (the logging schema from earlier), cache observability (hit rates and false-positive tracking on semantic matches), and model-level cost dashboards that break spend down by feature and route. None of this needs to be exotic. What matters is that the data flows into alerts, not just a dashboard nobody checks.
Concrete alert rules worth setting on day one:
- Daily spend exceeds 2× the rolling 7-day average: catches runaway loops and misconfigured retries before month-end
- Frontier-model route share exceeds a set threshold: signals your router is degrading or traffic mix has shifted toward harder queries
- Cache hit rate drops more than 10 points week over week: often means a prompt template changed upstream without anyone updating the cache key logic
- Retry rate climbs above your historical baseline: usually points to a schema change or an upstream API instability
Governance matters as much as the alerts themselves. Assign a named owner for cost, not just uptime. Require a release gate that runs every prompt or template change against your eval set before it ships. Schedule router recalibration monthly against fresh production logs, because the 200–500 example set that worked at launch stops representing your traffic within a couple of quarters.
How a Delivery Partner Fits Into the Cost Equation
Building the telemetry, caching, and routing infrastructure described above takes real engineering time, and every week spent building instrumentation instead of running the workload is a week of unoptimized spend. An approach to rapid MVP delivery, working software in under two weeks for eligible projects, is built around limiting that experimentation window: fixed pricing keeps scope from drifting mid-build, and a dedicated engineering team means the cost-tracking layer gets built once, correctly, instead of iterated on ad hoc.
If you’re weighing self-hosting against staying on hosted APIs, the deciding factor is rarely the model itself. It’s whether your team can operate the infrastructure reliably at the volume you actually have, not the volume you’re projecting for next year.
For teams considering self-hosting or on-prem inference for compliance reasons, data residency options matter as much as raw token economics. Some builds support choosing where data is stored and processed, which becomes relevant when a self-hosting decision is driven by regulatory requirements rather than cost alone. Related deep dives on local inference infrastructure and what a rapid MVP actually costs cover the adjacent engineering and budgeting questions in more depth.
Where I’d Start If I Were You
Here’s my honest read after working through the math above: most teams jump straight to model routing or fine-tuning because it feels like the “real” engineering work, while the boring stuff, prompt audits and exact-match caching, gets treated as a formality. That’s backwards.
If you do only eight things this quarter, do these, roughly in order:
- Instrument every request with tokens, model, route, and cache status.
- Run a full prompt audit and cut redundant tokens before touching anything else.
- Turn on exact-match provider caching for any static prompt prefix.
- Identify every workload with an offline tolerance and move it to batch endpoints.
- Write simple rule-based routing for your most obviously “easy” request category.
- Build a 200 to 500 example eval set from real logs before trusting any router.
- Set spend and cache-rate alerts so drift gets caught in days, not billing cycles.
- Only model fine-tuning or self-hosting once your token volume clears break-even, and not a moment before.
The one-line note that ties all of this together: none of it is a one-time project. Recalibrate the router monthly, re-audit prompts whenever a feature ships, and assign someone to actually own the cost line, because infrastructure that isn’t watched drifts back toward expensive defaults within a quarter.
— Lakitha