
Five Instrumented MVP Success Metrics Founders Must Track
Five Instrumented MVP Success Metrics Founders Must Track

Five metrics decide whether an MVP is working: activation rate, time-to-first-value, cohort retention (D1/D7/D30), engagement depth, and a business viability check like CAC and LTV:CAC. The rule that ties them together matters more than the list itself: write your hypothesis and set numeric acceptance criteria before a single line of code ships. Without that threshold, you’re not measuring success. You’re just collecting numbers and deciding after the fact whether you like them.
TL;DR:
- Focusing on activation rate, time-to-first-value, and retention metrics early reveals product issues before revenue declines or churn occurs.
- Setting clear, quantifiable success criteria and hypotheses before building avoids confirmation bias and helps make objective decisions.
- Tracking cohort retention at D1, D7, and D30 provides insights into onboarding friction, early engagement, and long-term habit formation.
- Business viability depends on maintaining a low customer acquisition cost relative to lifetime value, with ratios ideally at 3:1 or better.
- Avoid relying on vanity metrics like total signups or downloads and instead measure actionable indicators that influence product and strategy decisions.
Table of Contents
- Define MVP Success Before You Build It
- The North Star Framework: One Metric, Three Inputs
- Activation, Time-to-First-Value, and Engagement Depth
- Business Viability Checks: CAC, LTV, and the Ratio That Matters
- Stop Tracking Vanity Metrics, Start Tracking These Instead
- Setting Up Dashboards and a Weekly Review That Drives Decisions
- How Zatersio Approaches Instrumented MVP Pilots
- When to Measure: Pre-Launch, Launch Baseline, and the Iteration Cadence
- Retention Cohorts: What D1, D7, and D30 Actually Reveal
- Why Leading Indicators Beat Revenue in the First 90 Days
- Build an Instrumented MVP with Zatersio
- Sources
- FAQ
Define MVP Success Before You Build It
Most founders build first and figure out what “success” means after launch, staring at a dashboard trying to decide if 12% activation is good or bad. That’s backwards. The teams that make clean calls on their MVP write the hypothesis and the pass/fail line before writing code, because setting thresholds after you see the data invites confirmation bias. You’ll unconsciously rationalize whatever number shows up.
A testable hypothesis names three things: the customer, the action, the outcome. Not “tradespeople will like this app” but “solo electricians who quote three or more jobs a week will complete a quote in under two minutes using our tool.” That’s measurable on day one.
From there, set quantitative acceptance criteria:
- Activation threshold. A clear proportion of signups should complete the core action within a couple of days to validate the concept, or else it does not validate.
- Retention floor. A minimum level of one-week retention for the target cohort is critical; significantly below that indicates a product with poor user retention.
- Engagement signal. Users who activate return at least twice in the first week, proving the core loop has pull.
- Business check. The cost to acquire an activated user should be maintained under a budgeted amount relative to the expected lifetime value to ensure viability.
This is the Minimum Viable Metrics approach: one North Star, two or three supporting inputs, and one or two business health checks. A focused metric set built around a pre-defined hypothesis gives founders a far cleaner signal than tracking everything the analytics tool offers by default.
The North Star Framework: One Metric, Three Inputs
Pick a North Star metric that represents the moment your product delivers real value, then choose the handful of inputs that actually drive it. Everything else is noise you can check later.

Start by mapping the value path: signup, first meaningful action, repeat use, expansion. The North Star sits at “repeat use,” not “signup,” because signups measure interest, not value delivered.
Examples by business model:
- SaaS tool for trades businesses: North Star is “invoices sent per active account per week.” Supporting inputs are activation rate, time-to-first-invoice, and week-two return rate.
- Marketplace connecting clients and providers: North Star is “completed transactions per week.” Supporting inputs are supply-side fill rate, time-to-first-match, and repeat booking rate within 30 days.
- Consumer habit app: North Star is “sessions with a completed core action per user per week.” Supporting inputs are D1 activation, streak length, and push-notification opt-in rate.
Keep the total metric count between three and five. Research on pre- and post-launch product metrics consistently finds that a small, stable set of inputs tied to one North Star keeps teams from drowning in dashboards they never act on. Add a sixth metric only when you can name the exact decision it will change. If you can’t, it’s a vanity number waiting to happen.
Activation, Time-to-First-Value, and Engagement Depth
These three leading indicators tell you whether your MVP works before revenue or churn data even exists, and they’re far more useful early than any lagging measure. Industry guidance on leading versus lagging indicators backs this up directly: leading signals like activation and early engagement patterns give you a read on trajectory weeks before revenue would confirm or deny it.
Activation is the first moment a user experiences your core value, not the moment they sign up. For a scheduling tool, that’s booking a first appointment. For a marketplace, it’s completing a first transaction. Define it narrowly. “Logged in” is not activation. “Did the thing the product exists to do” is.

Time-to-first-value measures how long it takes a new user to hit that activation moment. Shorter is almost always better; a set of core MVP metrics including time-to-first-value shows up repeatedly in practitioner guidance because delay kills momentum. If your average user takes six days to get value, most of them churn before day six ever arrives.
Engagement depth covers frequency, session length, and feature adoption after activation. It’s your early proxy for retention before you have enough cohort data to trust a D30 number.
| Metric | What it tells you | Warning sign |
|---|---|---|
| Activation rate | Whether the core value is reachable | Under 20% for most B2B tools signals onboarding friction |
| Time-to-first-value | How fast users reach that value | A high time-to-first-value for a simple tool is a red flag |
| Session frequency | Whether the habit is forming | Users activate once and never return |
| Feature adoption | Whether secondary features earn their build cost | A feature under 10% adoption after 60 days rarely justifies more investment |
Pro Tip: Pair every quantitative metric with five minutes of qualitative context. A support ticket or a quick user call explaining why activation stalled is worth more than another week of watching the same flat line on a dashboard.
Business Viability Checks: CAC, LTV, and the Ratio That Matters
Activation and retention tell you if people want the product. CAC, LTV, and LTV:CAC tell you if the business survives. Both checks matter, and skipping the second one is how founders build something people love that never makes money.
- Customer acquisition cost (CAC): total spend on acquisition (ads, sales time, referral incentives) divided by the number of customers acquired in that period. Track it even at zero paid spend. Your own hours have a cost.
- Early LTV estimate: average revenue per user multiplied by expected customer lifespan in months. At MVP stage this is a rough proxy, not a finance department forecast, and that’s fine.
- LTV:CAC ratio: a widely used early benchmark is 3:1 or better. Below 1:1, you’re paying more to acquire customers than they’ll ever return.
- No revenue yet? Use proxies. Deposits, pilot fees, letters of intent, or demo-to-pilot conversion rate all signal willingness to pay without a full pricing model.
- Set the threshold before launch. If your pilot conversion rate stays under 15% qualified demo to signed pilot, that’s your trigger to revisit positioning, not push harder on the same pitch.
These business checks belong in your acceptance criteria alongside activation and retention, not as an afterthought six months later. A tool that nails engagement but shows a 5:1 CAC-to-LTV ratio in the wrong direction isn’t ready for more investment. It’s ready for a pricing conversation.
Stop Tracking Vanity Metrics, Start Tracking These Instead
Total signups, app downloads, and pageviews feel good on a slide deck and tell you almost nothing about whether your MVP works. A comparison of MVP measurement approaches consistently flags these as the numbers founders lean on when the real metrics look shaky.
Run every metric through one test: would this number change what you do next week? If the answer is no, drop it.
- Vanity: total signups. Replacement: activation rate, the percentage of signups who actually reach first value.
- Vanity: pageviews or app opens. Replacement: session frequency tied to a completed core action, not a passive visit.
- Vanity: social media followers. Replacement: referral conversion rate, how many referred users activate.
- Vanity: total downloads. Replacement: D7 cohort retention, how many downloaders are still using the product a week later.
None of these replacements are harder to track. They’re just less flattering when the news is bad, which is exactly why they’re more useful.
Setting Up Dashboards and a Weekly Review That Drives Decisions
Instrumentation doesn’t need to be elaborate. It needs to capture the handful of actions that represent real progress, then get reviewed on a fixed schedule so the data actually changes what you build next.
Start with a minimum event list: account created, activation event completed, core action repeated, and (if applicable) payment or pilot commitment. Attach basic properties to each: user segment, timestamp, and acquisition source. That’s enough to build every metric in this article.
Lay your dashboard out as a single-page scorecard:
- North Star metric, trending weekly.
- The three supporting inputs beneath it.
- Business checks: CAC, LTV:CAC, or your revenue proxy.
- The top three experiments currently running, with owner and expected result date.
Run a weekly review against that scorecard, not a monthly one. Early-stage teams that tie a fixed weekly cycle to their scorecard, running one experiment against the weakest metric rather than changing five things at once, get cleaner signal on what actually moved the needle.
How Zatersio Approaches Instrumented MVP Pilots
Working MVPs can be built in under two weeks, with instrumentation for activation, time-to-first-value, and retention included from day one, not added after launch. A fixed-price pilot with a dedicated engineering team can be aligned to your acceptance criteria, and documented experiments may support an R&D Tax Incentive claim for eligible projects. If your hypothesis and thresholds are already written down, this is what testing them looks like in practice.
When to Measure: Pre-Launch, Launch Baseline, and the Iteration Cadence
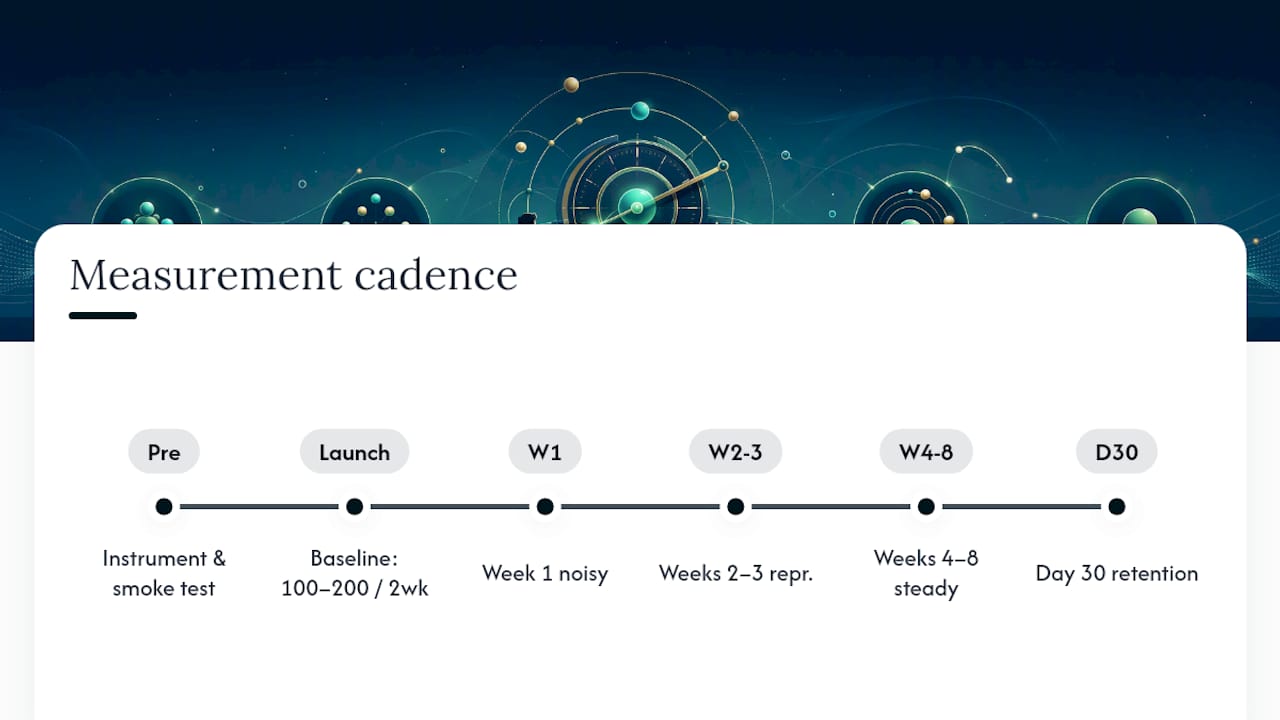
Measurement starts before launch, not after. Skip this step and you’ll have no baseline to compare anything against once real users show up.
Pre-launch: Write your hypothesis and set numeric acceptance criteria, as covered above. Also instrument your analytics and run a smoke test with five to ten target users if possible, just to confirm events are actually firing correctly. Nothing is worse than launching for three weeks only to discover your activation event never logged a single completion.
Launch baseline: Your first 100 to 200 real users, or your first two weeks, whichever comes first, sets your baseline. Don’t overreact to the first three days of data. Early users often behave differently from your actual target customer, particularly if they came from a friends-and-family list or a founder’s personal network. Treat baseline week one as noisy and week two or three as more representative.
Post-launch iteration: Once baseline is set, shift to the weekly review cadence described earlier. Most MVPs need four to eight weeks of consistent data before a retention curve becomes trustworthy enough to act on with confidence, since D30 numbers by definition take 30 days to even exist for your earliest cohort.
The mistake founders make most often is checking daily and reacting to noise, tweaking onboarding copy because Tuesday’s activation number dipped. Weekly reviews smooth that out. Daily checks are fine for catching bugs or outages, not for making product decisions.
Retention Cohorts: What D1, D7, and D30 Actually Reveal
Retention is frequently the single most telling number an MVP produces, because it measures whether the value you promised on day one still holds up on day thirty. Analysis linking retention gains to unit economics shows why: small retention improvements compound, lowering effective CAC and raising LTV without a single new acquisition dollar spent.
Cohort measurement means grouping users by the week or day they signed up, then tracking what percentage of each cohort is still active at fixed intervals.
- D1 retention tells you whether the first session delivered enough value to bring someone back tomorrow. Weak D1 usually points to onboarding friction, not a bad core idea.
- D7 retention tells you whether the product survived first-week novelty. This is often the number that separates “interesting demo” from “thing people actually use.”
- D30 retention tells you whether a habit or dependency has formed. This is the number investors and your own gut instinct should weight most heavily before scaling spend.
Churn is simply the inverse: the percentage of a cohort that stops returning between intervals. A product losing 80% of users between D7 and D30 has a habit-formation problem, even if D7 itself looked healthy. Compare cohorts against each other, not just against an absolute target. If your D7 retention is improving cohort over cohort as you ship onboarding fixes, that trend line matters more than any single week’s snapshot.
Why Leading Indicators Beat Revenue in the First 90 Days
The conventional advice tells founders to chase revenue as the ultimate proof of concept. That advice is not wrong, exactly. It’s just too slow to be useful when you’re deciding whether to keep building.
Revenue is a lagging indicator. By the time it moves, weeks of user behavior already happened that you could have caught earlier with activation and time-to-first-value data. The gap between what most MVP advice promises (build it, launch it, watch the money) and what actually helps founders decide (instrument the first ten minutes of user behavior and watch that instead) is where most early-stage teams lose months.
What’s genuinely underrated is the discipline of writing acceptance criteria before launch. Everyone nods along to this in theory. Almost nobody does it, because it forces you to commit to a number that might embarrass you later. Do it anyway. A founder who sets “30% D7 retention or we pivot the core loop” and hits 18% has a clear, unemotional decision in front of them. A founder without that threshold just argues with their own optimism for another quarter.
Prioritize activation and time-to-first-value first. They’re the fastest, cheapest signals you’ll get, and they tell you where to fix the product before you’ve spent real money finding out the hard way.
— Lakitha
Build an Instrumented MVP with Zatersio
Zatersio builds the pilot and the measurement plan together, so you’re not bolting analytics onto a finished product after the fact. Every rapid MVP ships with the events, dashboards, and cohort tracking this article describes already wired in, on a fixed price with no scope surprises halfway through the two-week build.

That matters because most agencies treat instrumentation as an add-on, something you request after launch once you realize you can’t answer basic questions about activation or retention. Zatersio’s engineering team sets acceptance criteria with you before writing a line of code, then delivers a working product with the dashboard already tracking your North Star and supporting inputs from day one. For eligible Australian software projects, that documentation also supports your R&D Tax Incentive claim, since the hypothesis and instrumented results are already on record.
If you have a hypothesis and a rough sense of your acceptance thresholds, the next step is a conversation about scope and timeline. Start your MVP build with Zatersio and get a fixed-price pilot with the metrics framework built in from the first sprint.
Sources
For deeper detail on North Star frameworks, MVP cost planning, and R&D eligibility, see the MVP versus prototype comparison and MVP cost guide on the Zatersio blog.
- Leading and lagging indicators (Indeed career advice)
- MVP Success Metrics: How to Measure MVP Performance | Codevelo
- Essential Product Metrics for MVP: Pre- and Post-Launch North Stars by Model | EVNE Developers
FAQ
What Are Examples of MVP Success Metrics?
Activation rate, time-to-first-value, D7 and D30 cohort retention, engagement frequency, and a business check like LTV:CAC are the core examples most MVPs should track.
What Are the Best Metrics for Measuring Team Success During an MVP Build?
Track cycle time on experiments (how fast the team ships and reads a test), the number of decisions made against pre-set thresholds, and whether the weekly scorecard review actually changes what gets built next.
What Is MVP Methodology?
MVP methodology means building the smallest version of a product that lets you test a specific hypothesis about customer behavior, then using measured results, not opinions, to decide whether to expand, pivot, or stop.
Can You Give an Example of an Outcome Metric?
D30 retention is a clear outcome metric: it measures whether users still find enough value to return a full month after signing up, rather than just measuring an action like a click or a signup.
How Do You Know When an MVP Has Failed?
An MVP has failed its test when it misses the numeric acceptance criteria set before launch, such as activation staying under threshold for multiple consecutive weeks, not simply when growth feels slower than hoped.