
Reclaim More Than 20 Hours a Week With Report Automation for Teams
Reclaim More Than 20 Hours a Week With Report Automation for Teams
Report generation automation is the practice of scheduling live, normalized data to flow into a template that renders and delivers a finished report, often narrated by AI, without a person building it by hand each cycle. The result: hours saved every week, fewer copy-paste errors, and faster decisions because reports land before the meeting instead of after it. Pick one recurring report, document its metrics and cadence, and you have your starting point.
TL;DR:
- Automating report generation can save hours each week, reduce errors, speed up decision-making, and scale reporting without increasing headcount.
- The process involves four stages: data normalization, AI-driven insights, templated rendering, and scheduled delivery, with vendors offering flexible architectures.
- Usage frequency varies by report type, from daily operational KPIs to monthly client reviews, optimized to inform decision-making deadlines.
- Successful implementation requires careful scoping, clean data sources, pre-computed calculations, and continuous feedback to ensure trustworthiness.
- In-house builds take months, but companies like Zatersio offer rapid MVPs, fixed pricing, and scaling options, especially for teams with limited engineering resources.
Table of Contents
- What Are the Benefits of Automating Report Generation?
- How Does Automated Report Generation Actually Work?
- Who Uses Automated Reports and How Often?
- How Do You Implement Automated Reporting Step by Step?
- What Technology and Integration Choices Matter Most?
- What Does Automated Reporting Cost to Run and Scale?
- How Did Zatersio Cut Reporting Time for a Real Client?
- Which Delivery Model Fits Your Team: DIY, Low-Code, or Managed?
- What Are the Most Common Reasons Automated Reports Fail?
- What’s Overrated and Underrated About Report Automation?
- Ready to Automate Your Reporting Without the Guesswork?
- Sources
What Are the Benefits of Automating Report Generation?
The math is simple once you see it. Every hour someone spends pulling numbers into a spreadsheet is an hour not spent deciding what those numbers mean. Automating the reporting process shifts effort from producing reports to consuming insights, which is the entire point of building the pipeline in the first place.
The practical gains show up in four places:
- Analyst time reclaimed. Report assembly stops eating the hours that should go toward interpretation and strategy.
- Fewer errors. Manual copy-paste between spreadsheets is where broken formulas and stale numbers creep in; a fixed pipeline removes that step entirely.
- Faster decision cycles. Scheduling reports to land shortly before a meeting means stakeholders walk in already briefed, not scrambling for context.
- Scale without headcount. An agency running one client report can usually run fifty on the same architecture, because the marginal cost of one more scheduled job is low.
Pro Tip: Time a weekly report to arrive the evening before your Monday leadership meeting. Reviewers skim it over coffee instead of during the meeting itself.
How Does Automated Report Generation Actually Work?
Every automated reporting system, regardless of vendor, breaks down into four stages: data, intelligence, rendering, and delivery. Understanding this pipeline matters more than memorizing any single tool, because it’s what lets you evaluate a vendor’s architecture instead of taking their word for it.
- Data ingestion and normalization. Connectors pull from APIs, databases, or spreadsheet exports, then reshape everything into one consistent schema so downstream steps don’t have to guess field names.
- Intelligence layer. This is where comparisons, trends, and anomaly detection happen, ideally in code before anything touches a language model. A working AI report workflow needs six defined parts: scope, data sources, prompt structure, narrative generation, output formatting, and scheduled delivery.
- Rendering. Templates convert the structured output into PDF, PowerPoint, or Excel, with conditional sections that appear only when the data warrants them.
- Delivery and scheduling. Cron-style triggers fire the job, retry logic handles failed connector calls, and a review gate can hold the report for human approval before it reaches a client’s inbox.
An open-source reporting framework illustrates this pipeline concretely: data source, template engine, renderer, exporter, and scheduler as separate, swappable plugins.
Who Uses Automated Reports and How Often?
Cadence depends entirely on who’s reading. Match the frequency to the decision it’s supposed to inform, not to what’s technically easy to schedule.
- Agency client reports. Monthly, white-labeled PDFs or PPTX decks covering campaign performance, usually the first thing agencies automate because the format repeats client after client.
- Executive briefings. Weekly or daily condensed summaries built for skimming, not deep analysis. Leadership wants the headline, not the raw table.
- Operational reports. Daily team KPIs and threshold alerts that flag problems before they become expensive ones.
- Compliance and regulatory exports. Reports built around an audit trail, where consistency and traceability matter as much as the numbers themselves.
Client-reporting products in this category can collapse a multi-hour monthly report into under a minute of generation time once the connectors and templates are set up, which is the entire economic case for building the pipeline once.
How Do You Implement Automated Reporting Step by Step?
Skipping steps here is how teams end up with a report nobody trusts. Work through this sequence in order.
- Scope it. Name the audience, the decision the report drives, the cadence, and the exact metrics required. A report with no clear decision behind it usually gets ignored within a month.
- Inventory your data sources. List every source, how you’ll access it (API, OAuth, direct database query, manual export), and what normalization each one needs before it fits your schema.
- Pre-process before the model sees anything. Calculate period-over-period comparisons and flag anomalies in code first. Pre-aggregating comparisons before the LLM touches the data produces far more reliable output than asking the model to spot trends on its own.
- Design the prompt and template together. Define exact sections: a TLDR, key wins, risks, and a metrics table. The template and the prompt should mirror each other so the narrative always lands in the right place.
- Choose rendering and delivery. Decide on PDF, PPTX, or Excel, and pick the distribution channel, whether that’s email, Slack, or a shared drive.
- Build in a feedback loop. A simple thumbs-up or thumbs-down on each report, reviewed monthly, turns prompt tuning into ongoing improvement instead of a one-time setup task.
Pro Tip: Build the metrics table before you write a single word of narrative prompt. If the table doesn’t answer the reader’s question on its own, no amount of AI writing will fix it.
What Technology and Integration Choices Matter Most?

Connector choice is usually the first fork in the road. Direct API access gives you the freshest data but demands the most engineering upkeep; pulling from a data warehouse is more stable but adds a sync delay; CSV or Google Sheets exports are the fallback when nothing else is available, though they’re the most fragile link in the chain.
The bigger decision is how you feed data to the language model:
- Structured JSON beats free text. Asking a model to parse a raw API dump invites hallucinated numbers. Building a clean, single-source-of-truth schema before the LLM sees any data is what keeps the narrative auditable.
- Pre-compute the math, not just the fetch. Calculate z-scores, rolling averages, and percent-change objects like
{metric, current, prior, change_pct, vs_target_pct}in code, then hand the model a small, clean payload instead of a spreadsheet dump. - Security controls aren’t optional. Read-only OAuth scopes, field-level masking for sensitive data, defined retention windows, and a choice of data residency all belong in the architecture from day one, not bolted on after a client asks.
If you’re evaluating vendors, ask how they handle document formatting for AI discoverability too. Making PDF outputs citable and machine-readable is becoming a real factor in how reports get referenced downstream.
What Does Automated Reporting Cost to Run and Scale?
Budget breaks into five buckets: hosting, LLM or API calls, PDF/PPTX rendering, connector or SaaS fees, and the engineering time to wire it all together. None of these are exotic costs, but they add up differently depending on scale.
- For a single weekly report on a self-hosted setup with low-cost connectors, total monthly costs often stay under $50 once the initial build is done.
- Agency-scale operations running the same pipeline across dozens of clients see costs climb with connector fees and API volume, but the marginal cost per additional client report drops sharply because the architecture is shared.
- Batching LLM calls, caching repeated queries, and designing a multi-tenant schema from the start are the three levers that keep marginal cost low as you add clients or teams.
Fixed-price engagement models remove the guesswork here. Zatersio’s published pricing gives a concrete reference point for what a scoped automation build costs versus an open-ended hourly contract.
How Did Zatersio Cut Reporting Time for a Real Client?
Numbers persuade better than promises. A Melbourne firm working with Zatersio reclaimed more than 20 hours a week by automating the recurring workflows that used to eat their staff’s mornings, reporting included.
That outcome reflects how Zatersio typically works with clients building this kind of system:
- Rapid MVP delivery, often in under two weeks, so the first working version reaches your team fast instead of after a months-long build.
- Fixed pricing agreed upfront, with no surprise invoices as scope gets clarified along the way.
- A dedicated engineering team you can reach directly, not a rotating support queue.
- Projects structured to qualify for the R&D Tax Incentive where eligible, which changes the real cost of building custom automation.
If your team has the engineering bandwidth and the data discipline to build this in-house, do it. If the report keeps sliding down the priority list, that’s the signal to bring in a team that ships fast.
Which Delivery Model Fits Your Team: DIY, Low-Code, or Managed?
Three paths lead to the same destination, and picking the right one depends on your team’s skills and how much control you need over the pipeline.
- Engineering-led builds. Python, Jupyter notebooks, and Excel-generation libraries give full control over logic and formatting. Open-source Excel report generators show how much is achievable with a small, skilled team and no vendor dependency.
- Low-code workflow platforms. These trade some flexibility for speed, offering pre-built connectors and drag-and-drop templating that gets a basic report running in days rather than weeks.
- Managed builds and agencies. When you need white-labeling, guaranteed uptime, or speed to market, a team that builds this professionally, like Zatersio’s automation service, removes the trial-and-error entirely.
Match the choice to what you actually have: a strong internal engineering team leans DIY, a lean operations team leans low-code, and anyone racing a deadline or compliance requirement usually leans managed.
What Are the Most Common Reasons Automated Reports Fail?
Most failures trace back to data discipline, not the AI model itself. Start with one report, verify every number against the source before you trust the automation, and expand from there.
- Require the narrative to cite exact fields, never a vague summary the reader can’t trace back to a number.
- Keep a stable schema; feeding raw API dumps straight into a language model is the single most common cause of hallucinated figures.
- Build in an easy feedback mechanism and actively monitor for failed sends, not just successful ones.
- Add guardrails: a human review-before-send step, anomaly flags on unusual swings, and retention logs for anything touching compliance.
Pro Tip: The first version of any automated report should go to a human reviewer for two full cycles before it’s trusted to send itself. Treat that review period as part of the build, not a delay.
What’s Overrated and Underrated About Report Automation?
The industry oversells the “set it and forget it” pitch. Every credible workflow I’ve seen described, whether open-source or commercial, keeps a human review gate in the loop, at least at launch. That’s not a failure of the technology. It’s an acknowledgment that a report feeding a real business decision needs a sanity check before it reaches someone’s inbox.
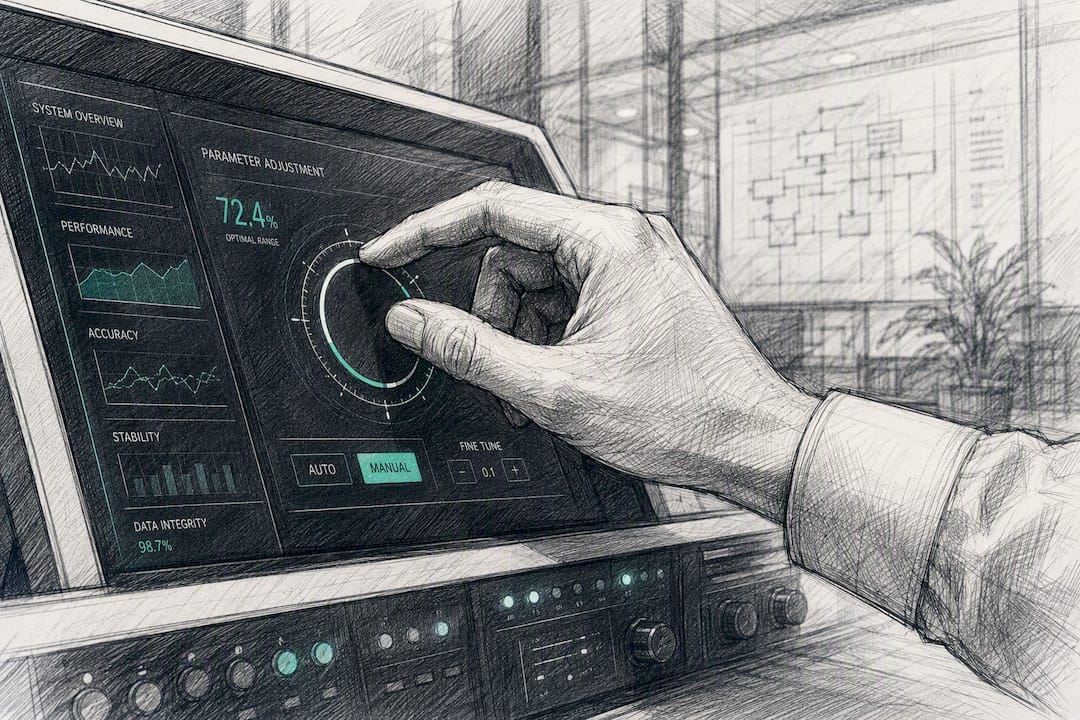
What’s underrated is the schema work nobody wants to do first. Teams want to jump straight to prompt writing because it feels like the fun part, but the pre-aggregation and JSON structuring step is what determines whether the AI narrative is trustworthy six months from now or quietly drifting into nonsense.
If you take one thing from this, prioritize the boring part first: nail down your metrics, your schema, and your cadence before you write a single line of prompt. The narrative layer is replaceable. A bad schema poisons everything built on top of it.
— Lakitha
Ready to Automate Your Reporting Without the Guesswork?
Building this in-house means months of connector work, prompt iteration, and template debugging before your first report ships. Zatersio compresses that timeline: a working MVP in under two weeks, fixed pricing agreed before work starts, and your choice of data residency so compliance stays clean from day one.
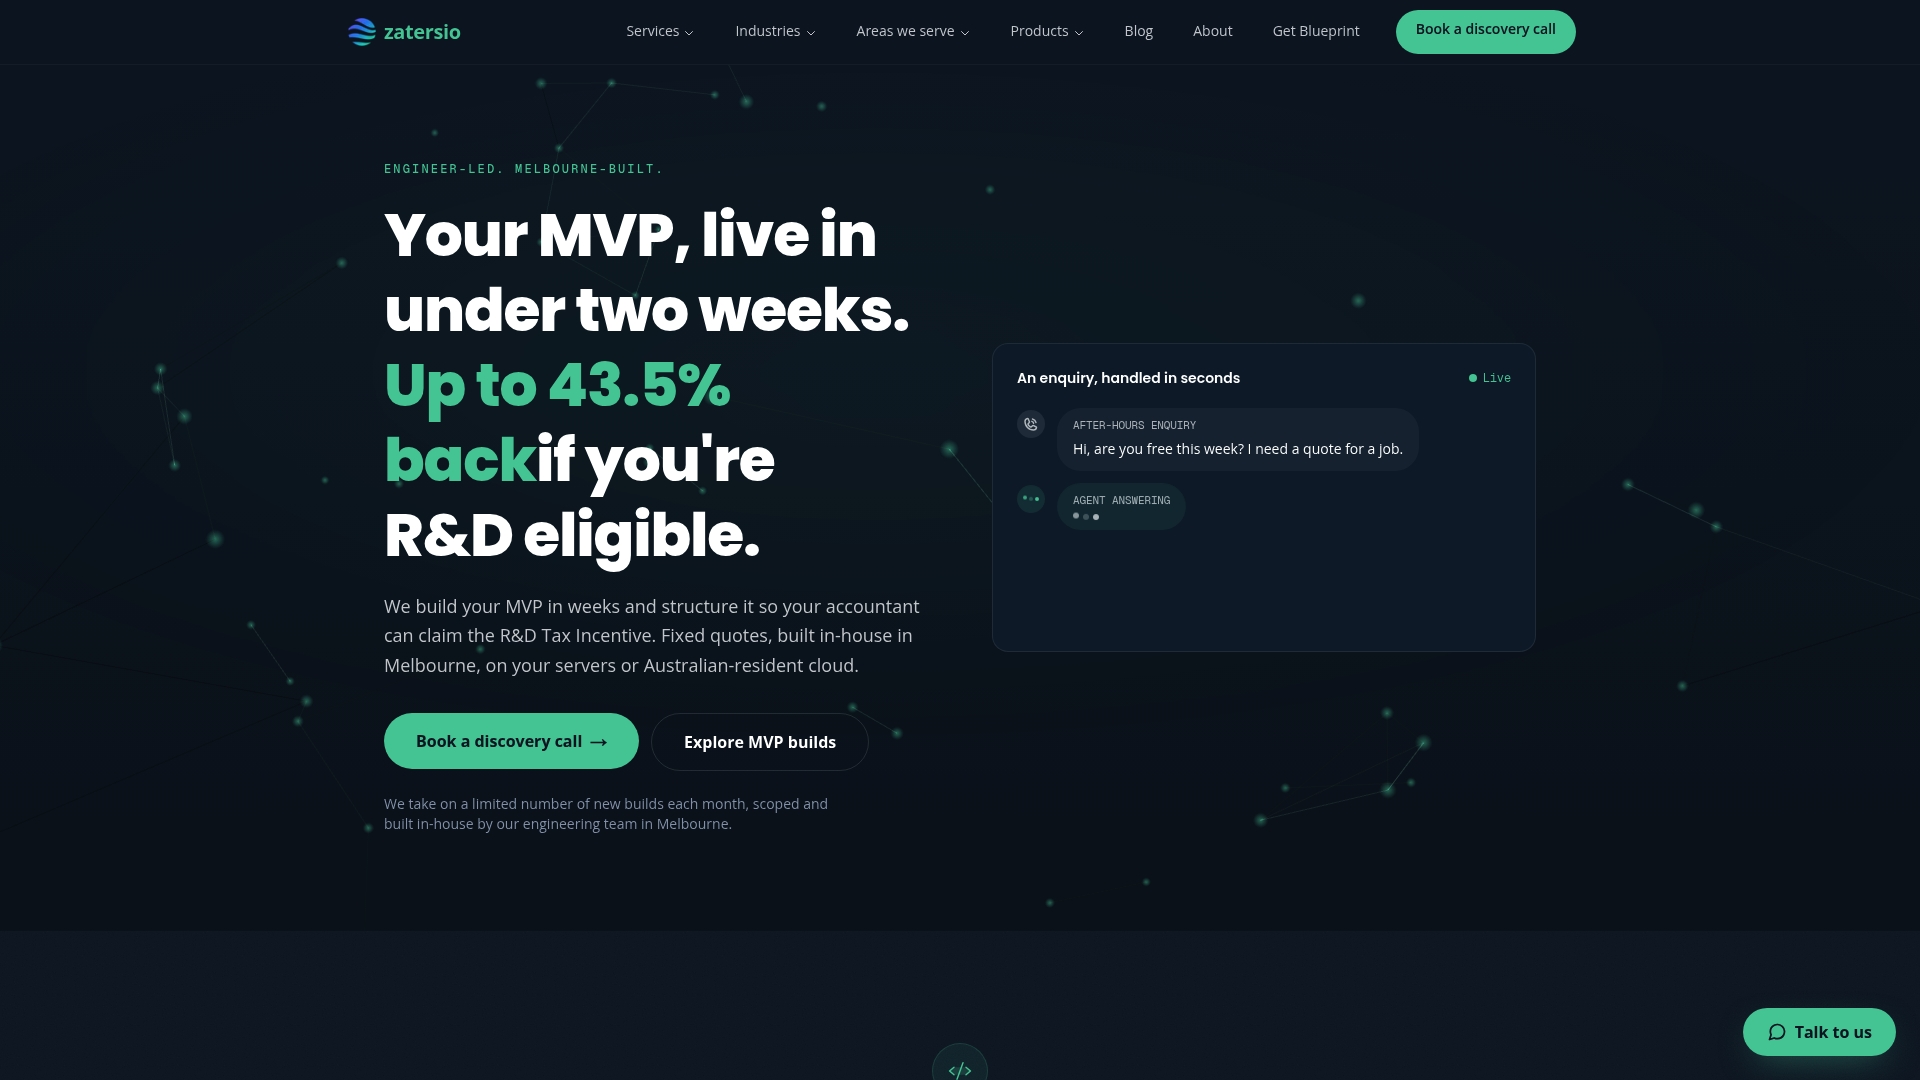
Zatersio’s engineering team has already built this kind of pipeline for firms across trades, healthcare, and professional services, wiring the connectors, structuring the schema, and shipping a working report system fast enough that most clients see it running before a traditional agency would finish the discovery phase. Projects that qualify get structured around the R&D Tax Incentive too, which changes the real economics of the build.
Start with the free AI automation blueprint to map out what your first automated report should look like, or go straight to scoping an MVP build if you already know which report is costing your team the most hours.
Sources
- How to automate business reporting (HubSpot blog)
- How to create an AI report generation workflow | Zarif Automates